Mapping Detroit’s K-12 Education Ecosystem
Detroit is home to hundreds of organizations working to improve education for children and families. Yet despite deep commitment across the city, the system remains fragmented, making it difficult for progress to scale and sustain.
To accelerate meaningful systems change, we must first understand who shapes education in Detroit, how decisions are made, and where connections break down.
This study maps the organizations, relationships, and structural conditions that define Detroit’s K–12 education ecosystem. It draws on:
- 24 qualitative interviews
- A network survey of 117 organizations across a broader network of 219 (November 2025 -March 2026)
- 3,224 documented organizational connections
- Two community conversations with The Skillman Foundation grant partners and civic leaders
Key Findings
“There’s no governing body in the city of Detroit, elected or otherwise, that’s actually accountable for all the kids in the city. This is a problem of design, likely intentional.”
Detroit education philanthropist
Together, these insights reveal both the complexity of education in Detroit and clear opportunities to strengthen alignment for impact.
Fragmentation is structural.
No one entity in Detroit is solely accountable for its more than 100,000 K–12 students. Students are spread across DPSCD, charter schools, and Schools of Choice, while key policy decisions are largely controlled by state-level actors outside the city.

Proximity to community does not always translate to decision-making power.
Organizations closest to students and families hold deep trust and legitimacy, yet they are often least integrated into the processes that shape education policy. The system lacks consistent pathways to translate community insight into policy decisions.

Five dynamics constrain community-led change.
- Community voice is often engaged after key decisions are already underway
- Families, not institutions, bear the burden of navigating fragmented systems
- Institutional data and community knowledge operate in parallel rather than in concert
- Community legitimacy does not translate into formal policy influence
- Dominant narratives shape which solutions and leaders are seen as credible.
Sustained progress requires long-term commitment.
Lasting systems change depends on investments that endure across political transitions, not one-time initiatives. This includes coordination infrastructure, shared data systems, and pathways that connect community voice to policy action.
Opportunities For Alignment
Unlocking community-driven change in Detroit’s education ecosystem requires stronger alignment across the system. At the core is a simple but powerful principle: connections must be intentional, strategic, and sustained to drive meaningful results. This begins with three reinforcing actions:
1
Strengthen connections across the ecosystem.
Detroit’s education system includes schools, nonprofits, government agencies, funders, and community leaders. Progress accelerates when these actors are intentionally connected, aligned around shared priorities, and able to act in coordination, rather than in isolation.
2
Focus on the dynamics that shape influence.
Real progress requires more than programs; it requires shifting the underlying conditions that determine whose voices matter, how decisions are made, and what outcomes are prioritized.
3
Commit to long-term, cross-administration priorities.
System-level change takes time and sustained attention. Key areas for continued investment include:
- Backbone coordination across sectors
- Parent organizing and leadership infrastructure
- Shared, cross-sector data systems
- Proven pathways that connect community voice to policy decisions
What It Will Take
This study was commissioned in service of People Powered Education, a theory grounded in the belief that Detroit youth, parents, educators, and community members should have the power to define, design, and influence the education system that most directly shapes their lives.
The findings are clear: Community voice can be a powerful driver of systems change, but only when the conditions exist to translate that voice into action and policy.
This analysis offers a clearer understanding of how Detroit’s education ecosystem functions today, highlighting where alignment is possible and where sustained, cross-administration focus can support real system-level progress.
Ecosystem Map
This interactive map shows connections among 16 sectors across Detroit’s K-12 education ecosystem. Node size reflects the number of known organizations within a sector. Solid lines represent a deeper depth of relationship. Use the map to see where sectors connect, gaps, and where new partnerships could strengthen the whole
How do I use this tool?

Navigating the Map
You can use your mouse to click and drag, scroll in and out, or use the “+” and “-” buttons in the top right-hand corner to zoom in and out. If at any point you want to re-center the map, just click the “Zoom fit” icon, below the “-“, shown in the image at the right.

Focusing on a Sector
If you’re interested in seeing a specific sector’s connections, either click and hold the dot, or use the focus icon, which appears after a dot has been selected. Once in focus mode, you can use the “+” and “-” buttons, show in the image below, to move up and down the degrees of connection – show immediate connections, connections of connections, etc.
Popovers
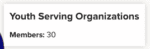
Use your mouse to hover over a sector to learn more. This will display a popover, which lets you know the name of the sector and the total number of members.
Mobile Phone
This tool is best support on large, desktop screens.
Where did this data come from?
The data presented on this page were collected through an online survey shared with members of Detroit’s K-12 education ecosystem. These data are supplemented with qualitative insights generated through interviews and focus groups in an effort to understand the breadth and depth of connections across the network. This work was funded by the Skillman Foundation and conducted by Sankofa Consulting.
A Closer Look at the Data
Connections
Connections refer to any interaction between organizations, formal or informal.
The survey identified 3,224 connections across 117 organizations, making visible how information moves across the system. These connections help reveal:
- Where relationships are strong or limited
- How organizations cluster around issues
- Opportunities to strengthen coordination
Connections By Sector
| Sector | Organizations | Total Connections | Connections per Organization | Percent within Sector |
|---|---|---|---|---|
| Institutes of Higher Education | 8 | 418 | 52.2 | 8.1 |
| Policy and Advocacy Organizations | 22 | 910 | 41.4 | 11.5 |
| Research and Data Organizations | 8 | 275 | 34.4 | 12.4 |
| Media | 16 | 532 | 33.2 | 8.6 |
| State Policymakers and Agencies | 9 | 297 | 33 | 6.1 |
| Investors and Foundations | 18 | 581 | 32.3 | 8.3 |
| K-12 Member Organizations and Unions | 9 | 286 | 31.8 | 8.4 |
| Youth Serving Organizations | 30 | 872 | 29.1 | 10.1 |
| K-12 Education Systems | 21 | 594 | 28.3 | 10.4 |
| Family and Community Organizations | 27 | 707 | 26.2 | 7.4 |
| Workforce Pathways and Training | 10 | 220 | 22 | 7.3 |
| City and County Government | 7 | 152 | 21.7 | 0 |
| Business and Industry Organizations | 15 | 321 | 21.4 | 5.6 |
| Charter Authorizers | 9 | 171 | 19 | 0 |
| Consultants | 5 | 64 | 12.8 | 0 |
| Technical Assistance Providers | 5 | 44 | 8.8 | 0 |
Measures of Centrality
Three measures help explain how sectors are positioned within the ecosystem:
- Degree (Reach): Which sectors are most broadly connected
- Closeness (Access): Which sectors can reach others most efficiently
- Betweenness (Bridging): Which sectors connect otherwise disconnected parts of the system
Centrality by Sector
| Sector | Organizations | Avg. Degree Centrality | Avg. Closeness | Avg. Betweenness |
|---|---|---|---|---|
| Institutes of Higher Education | 8 | 52.2 | 2.1 | 50.3 |
| Policy and Advocacy Organizations | 22 | 41.4 | 2.1 | 164.2 |
| Research and Data Organizations | 8 | 34.4 | 2.2 | 58.7 |
| Media | 16 | 33.2 | 2.2 | 133.9 |
| State Policymakers and Agencies | 9 | 33 | 2.1 | 119.5 |
| Investors and Foundations | 18 | 32.3 | 2.2 | 142.1 |
| K-12 Member Organizations and Unions | 9 | 31.8 | 2.2 | 49.9 |
| Youth Serving Organizations | 30 | 29.1 | 2.2 | 95.1 |
| K-12 Education Systems | 21 | 28.3 | 2.2 | 191.8 |
| Family and Community Organizations | 27 | 26.2 | 2.2 | 89.8 |
| Workforce Pathways and Training | 10 | 22 | 2 | 32.3 |
| City and County Government | 7 | 21.7 | 2 | 43 |
| Business and Industry Organizations | 15 | 21.4 | 2.2 | 157.5 |
| Charter Authorizers | 9 | 19 | 2.2 | 362 |
| Consultants | 5 | 12.8 | 2.4 | 93.3 |
| Technical Assistance Providers | 5 | 8.8 | 2.2 | 69.1 |
Navigate and Strengthen Your Organization’s Position
This map also exists at an organizational level. The organization-level map enables Skillman Foundation grant partners to actively navigate and strengthen their position within Detroit’s education ecosystem by identifying specific organizations to connect with to advance shared priorities.
Grant partner access is available upon request. Contact learningandimpact@skillman.org.